Observability for Coding Agents: From Black Boxes to Measurable Systems
Coding agents were fun when they felt like magic. You typed a request, something happened behind the curtain, and results appeared. Then usage‑based billing became the norm. The curtain stopped being charming and started being expensive. In my previous post, Reducing Token Usage in Code Agents, I focused on shrinking prompts, improving caching, and using semantic context to avoid unnecessary model calls. But saving tokens is only half the story. The other half is understanding where those tokens go, why they’re being spent, and how the agent behaves across an entire session.
That’s where observability comes in.
In earlier posts, I explored how agents understand your codebase (From Grep to Graph) and how they orchestrate work across VS Code, the CLI, and the cloud (Custom Agents in GitHub Copilot). But understanding and execution are only two sides of the triangle. The side that closes the loop is visibility. Without it, you’re flying blind in a world where every model call has a price tag.
Developers already know how to observe distributed systems. We’ve spent years building dashboards, traces, logs, and metrics for microservices. Coding agents deserve the same treatment. They are, after all, distributed systems in miniature: a planner, a set of tools, a semantic index, a graph, and a model that stitches everything together. Observability is what turns this from a black box into a measurable, optimizable system.
It Always Mattered, and It Matters Even More Now
Usage‑based billing changed incentives overnight. Every agent run consumes tokens. Every tool call consumes tokens. Every hallucinated detour, missing LSP signal, fallback to grep, or unnecessary retry has a cost. Saving tokens is reactive; you notice the problem after the bill arrives. Observability is proactive. It shows where tokens go, why they’re being spent, and how to reduce waste before it becomes expensive.
The moment you examine agent runs through an observability lens, you stop treating them as “AI magic” and start treating them as compute units with cost models. Once that mental model clicks, everything gets clearer.
The VS Code Observability Surfaces
VS Code has quietly become one of the richest observability environments for coding agents. The trick is knowing where to look. In current VS Code builds, the top-right corner of the chat window usually includes an ellipsis menu. From there, you can access the two most important entry points into the agent’s internal world: Chat Debug View and Agent Debug Logs. You can also open both through commands if you prefer keyboard-driven workflows.
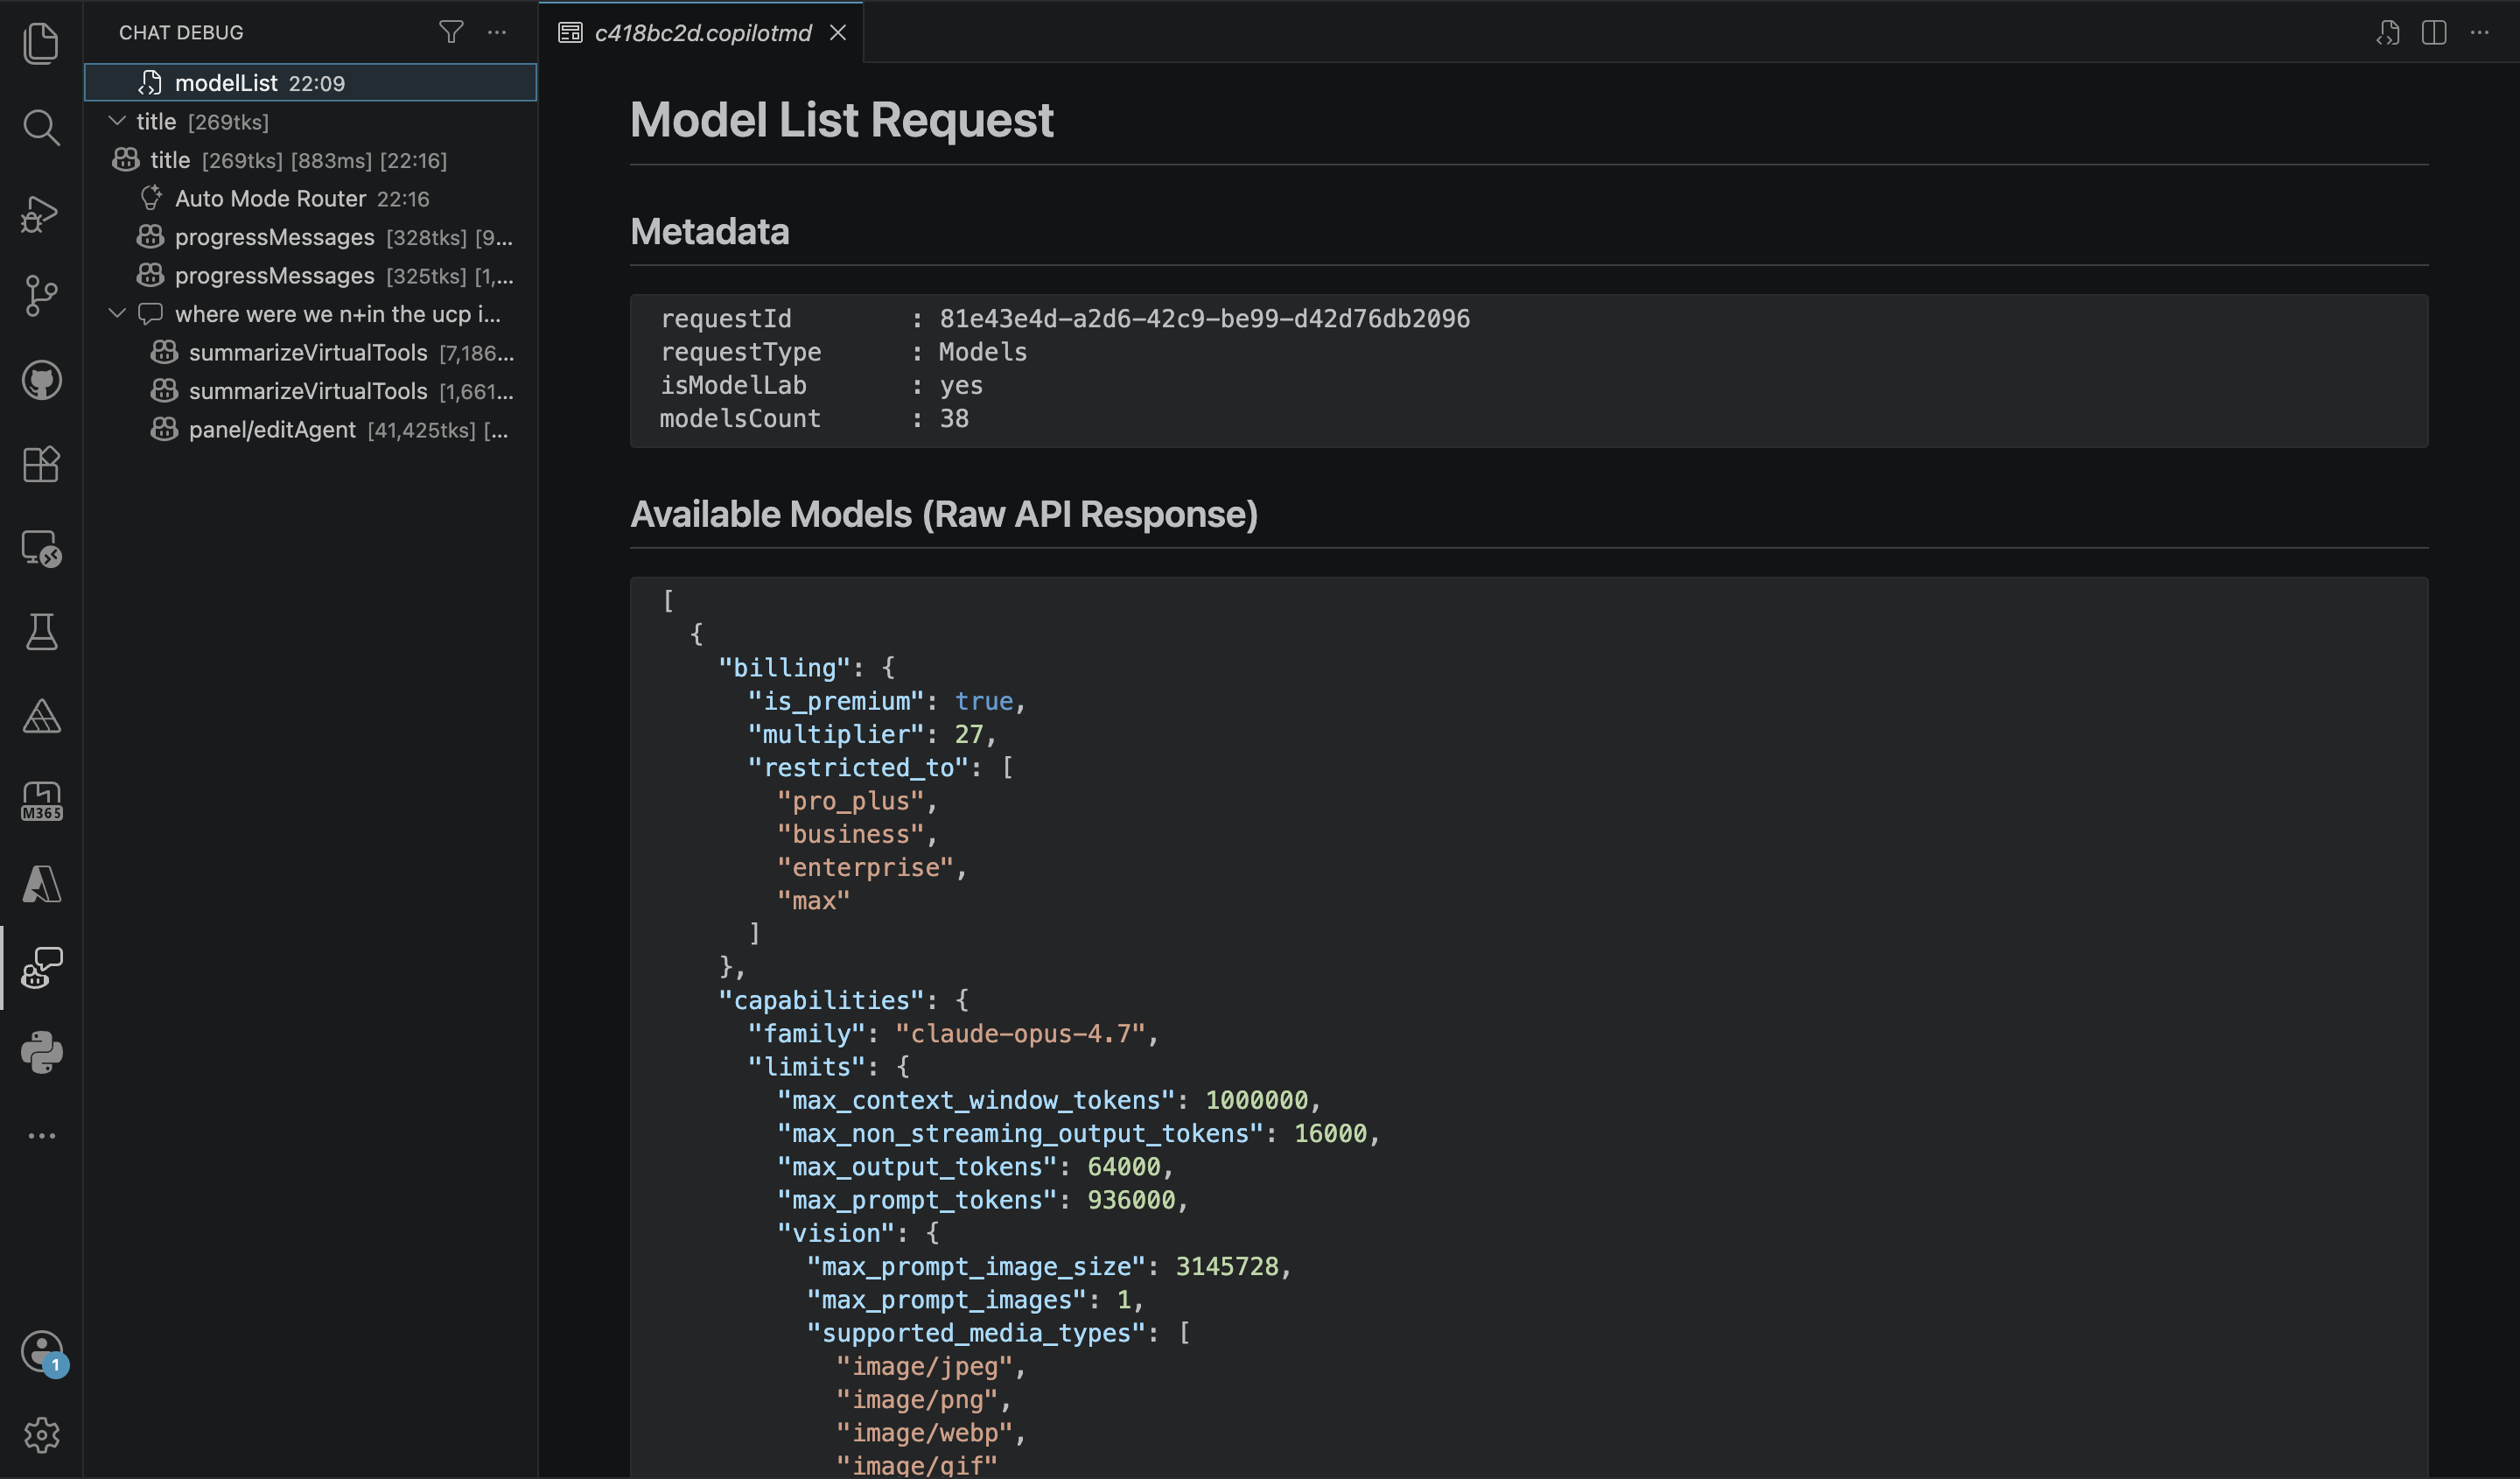
The Chat Debug View is the closest thing to watching the agent think in slow motion. It gives you a chronological, expandable trace of the entire run. You can open each node and see the prompts, the tool payloads, the intermediate reasoning, the token counts, and the execution times. It’s a timeline of cognition, and once you see it, you immediately understand why the agent made the choices it did.
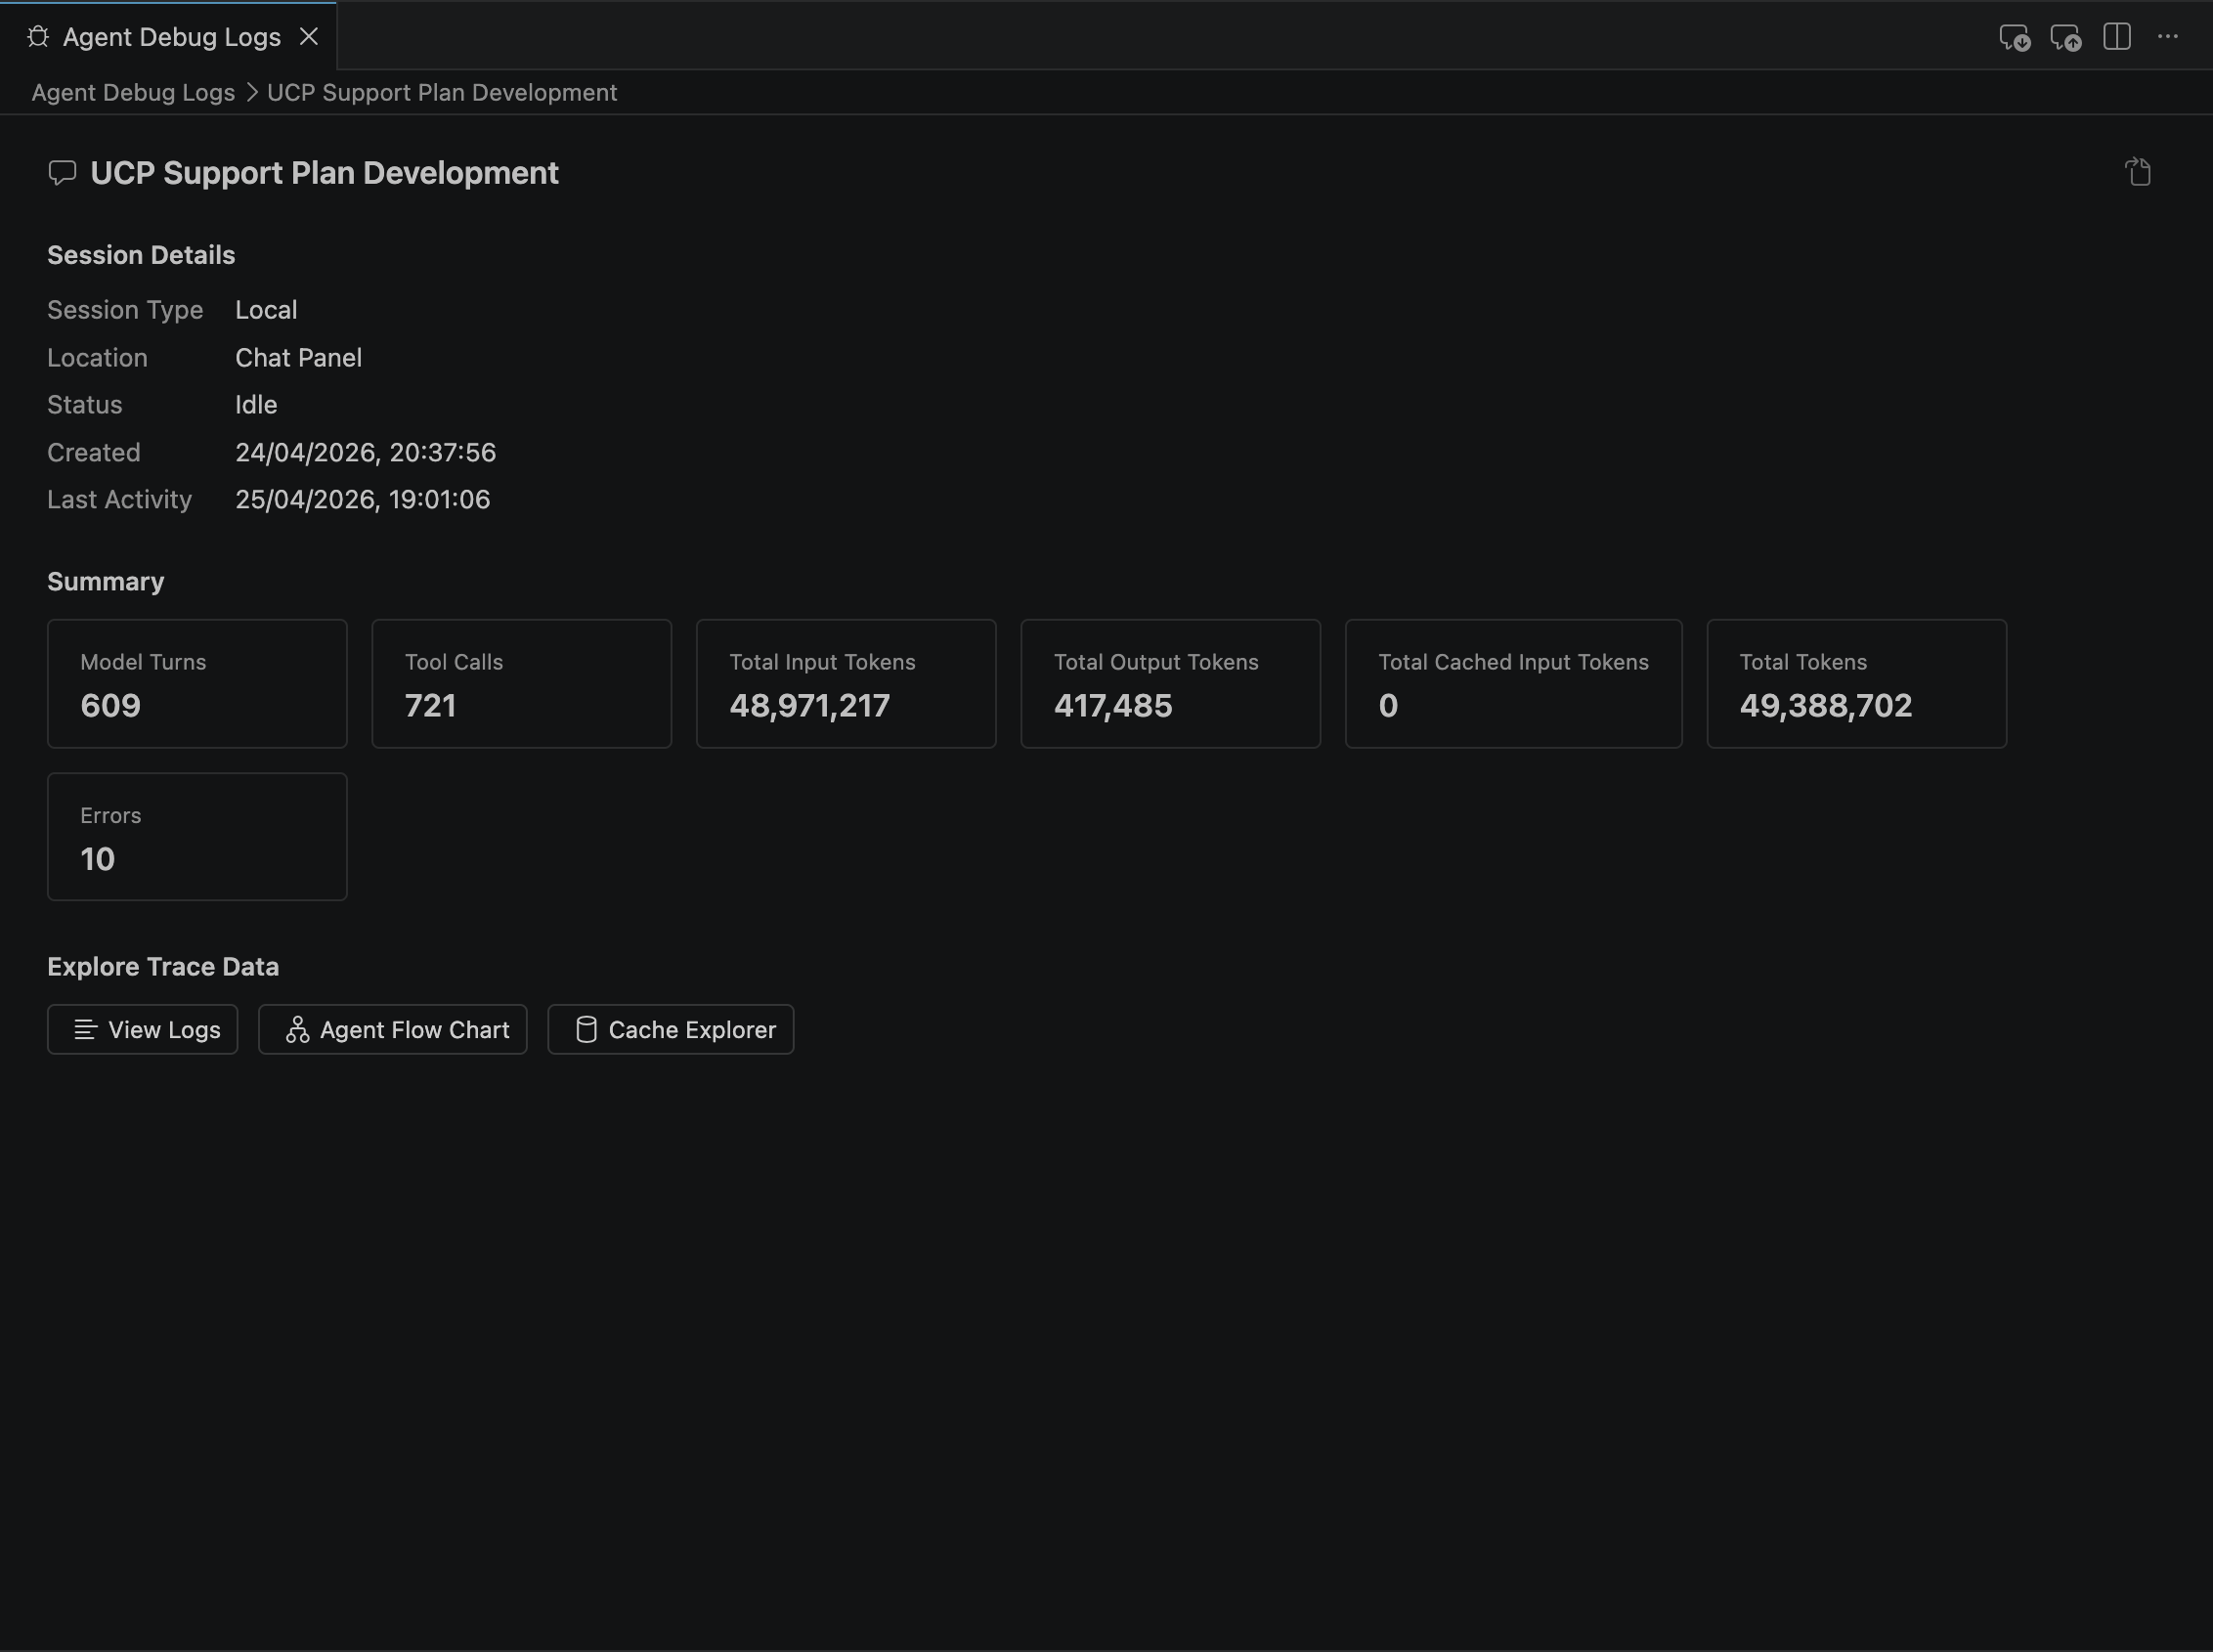
Agent Debug Logs go deeper. They show session-level details: model turns, tool calls, input/output tokens, cached tokens, errors, and timestamps. It is a high-level telemetry snapshot that tells you whether the run was efficient, wasteful, or unexpectedly expensive. From there, you can branch into three specialized views that make observability multi-angle.
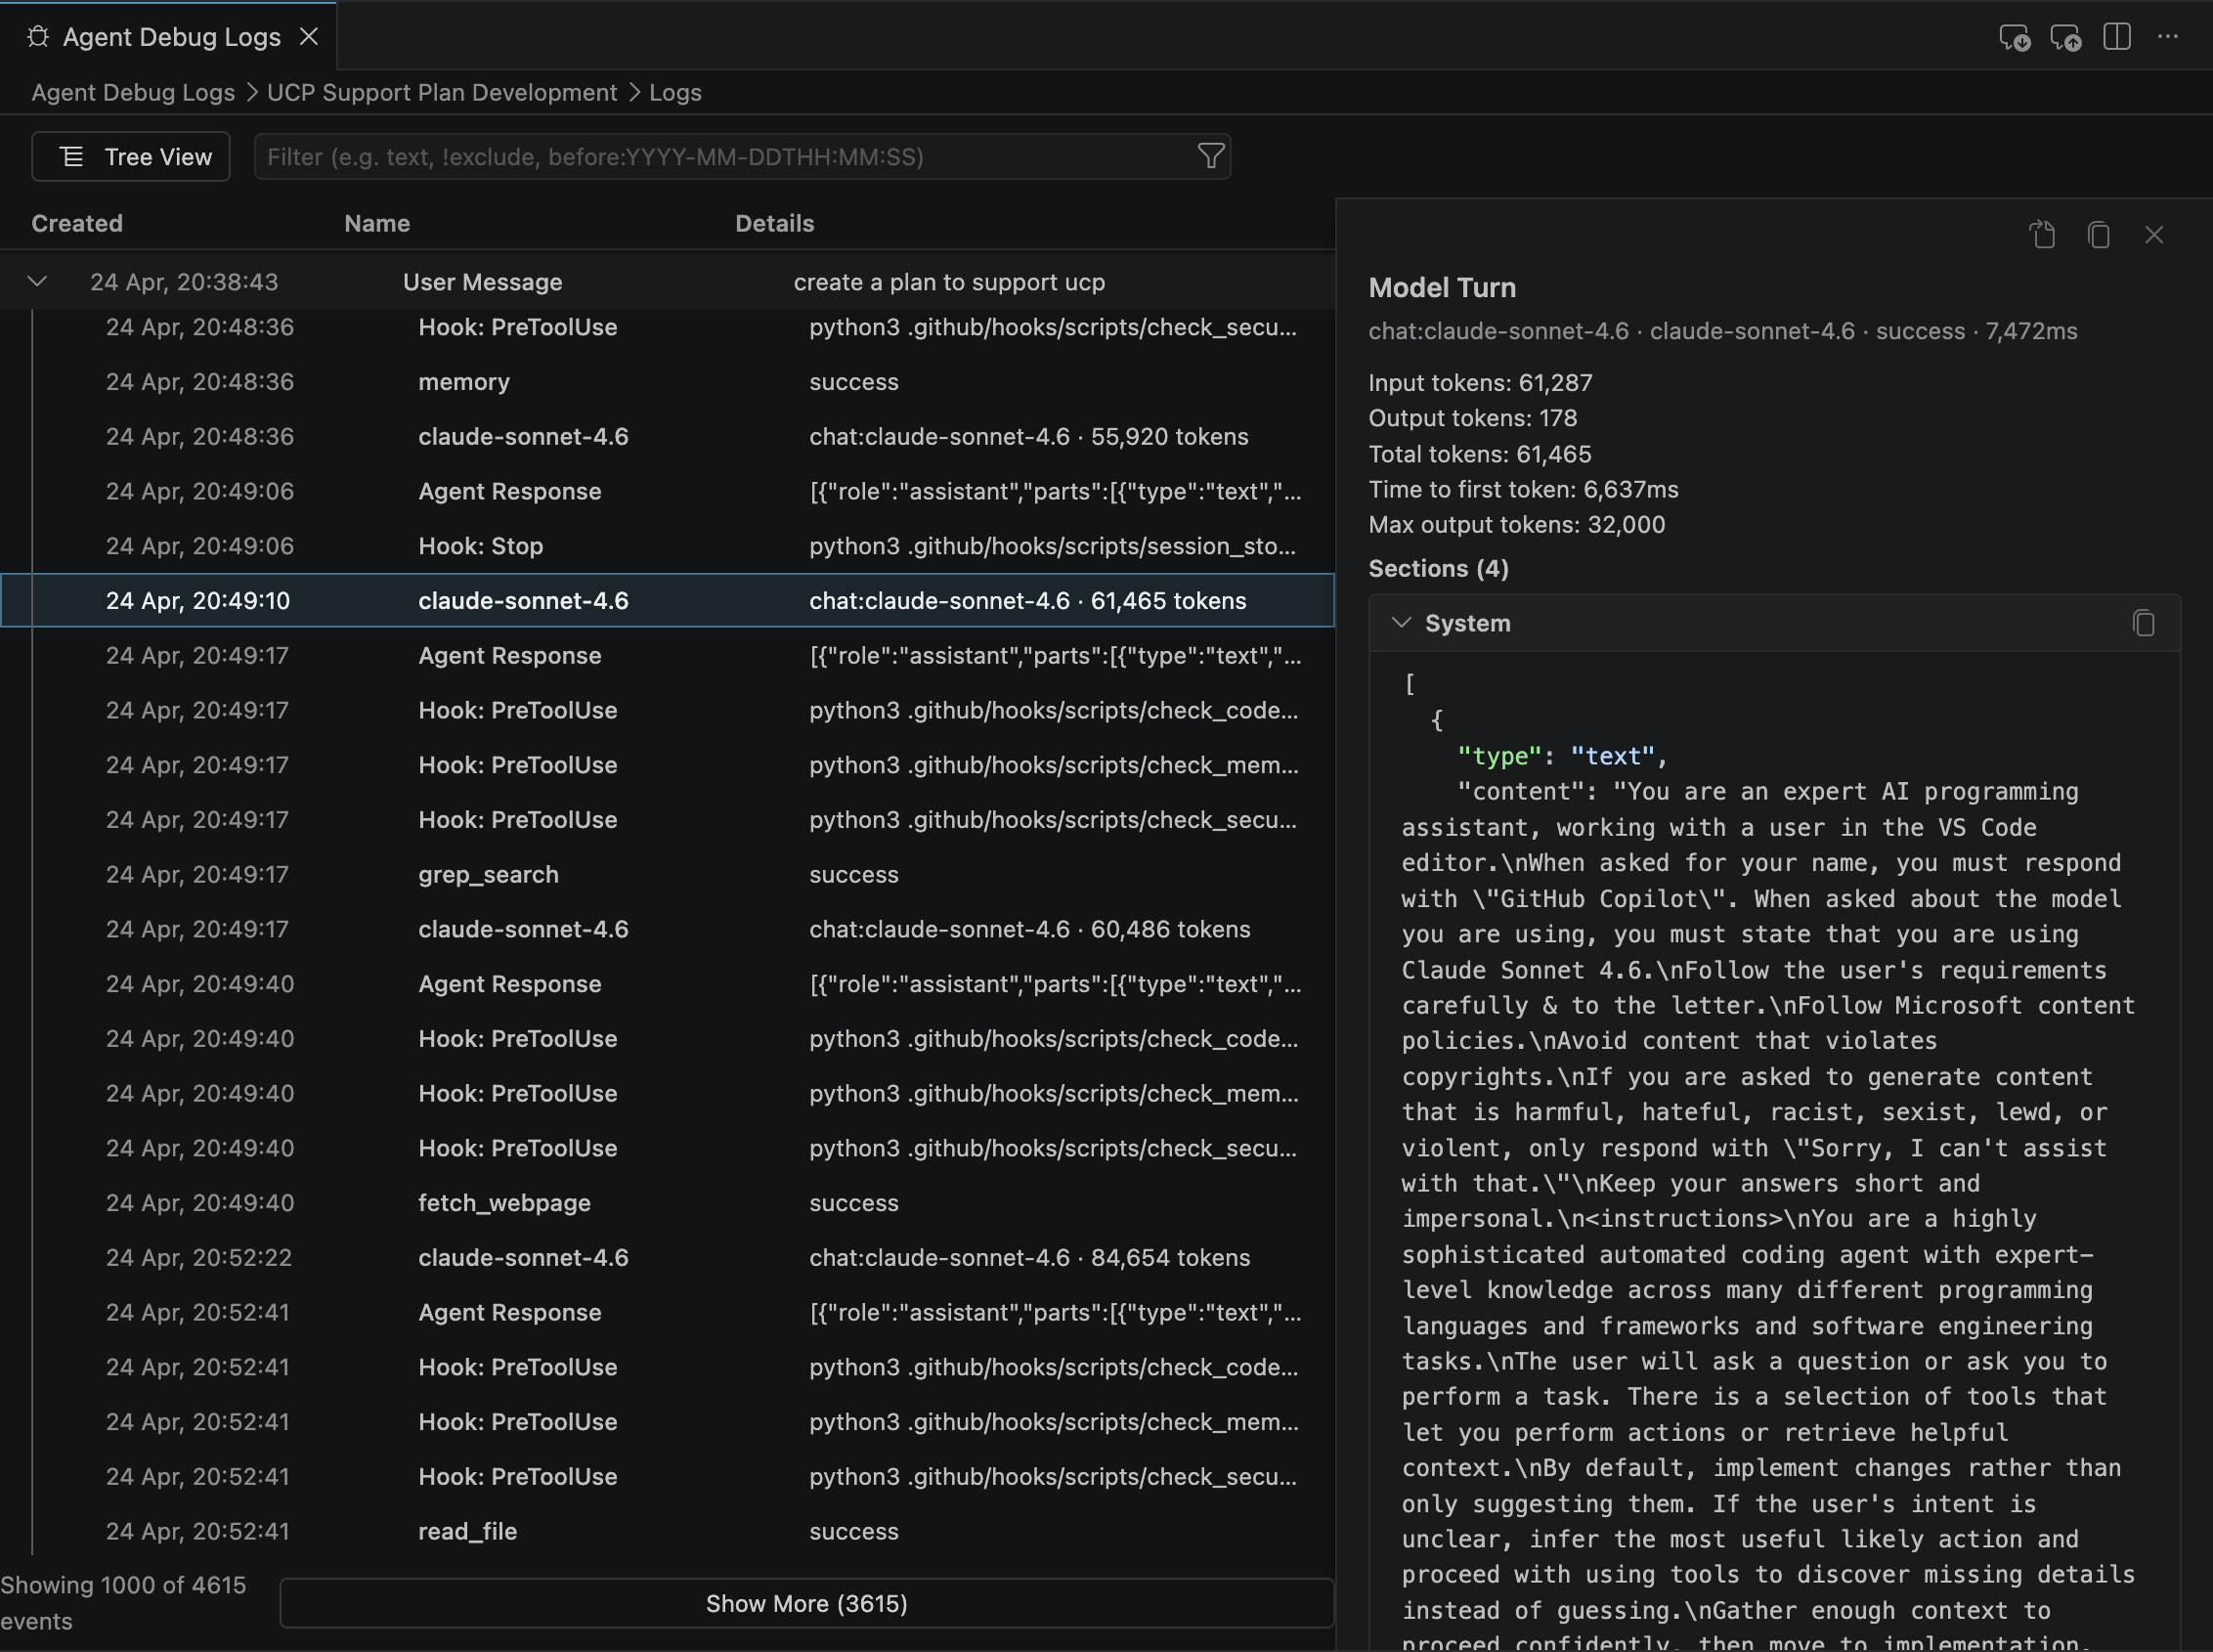
The first is View Logs, which exposes the raw event stream: every tool call, every hook, every model invocation, every patch applied to your workspace. It’s the structured, searchable version of the Chat Debug View.
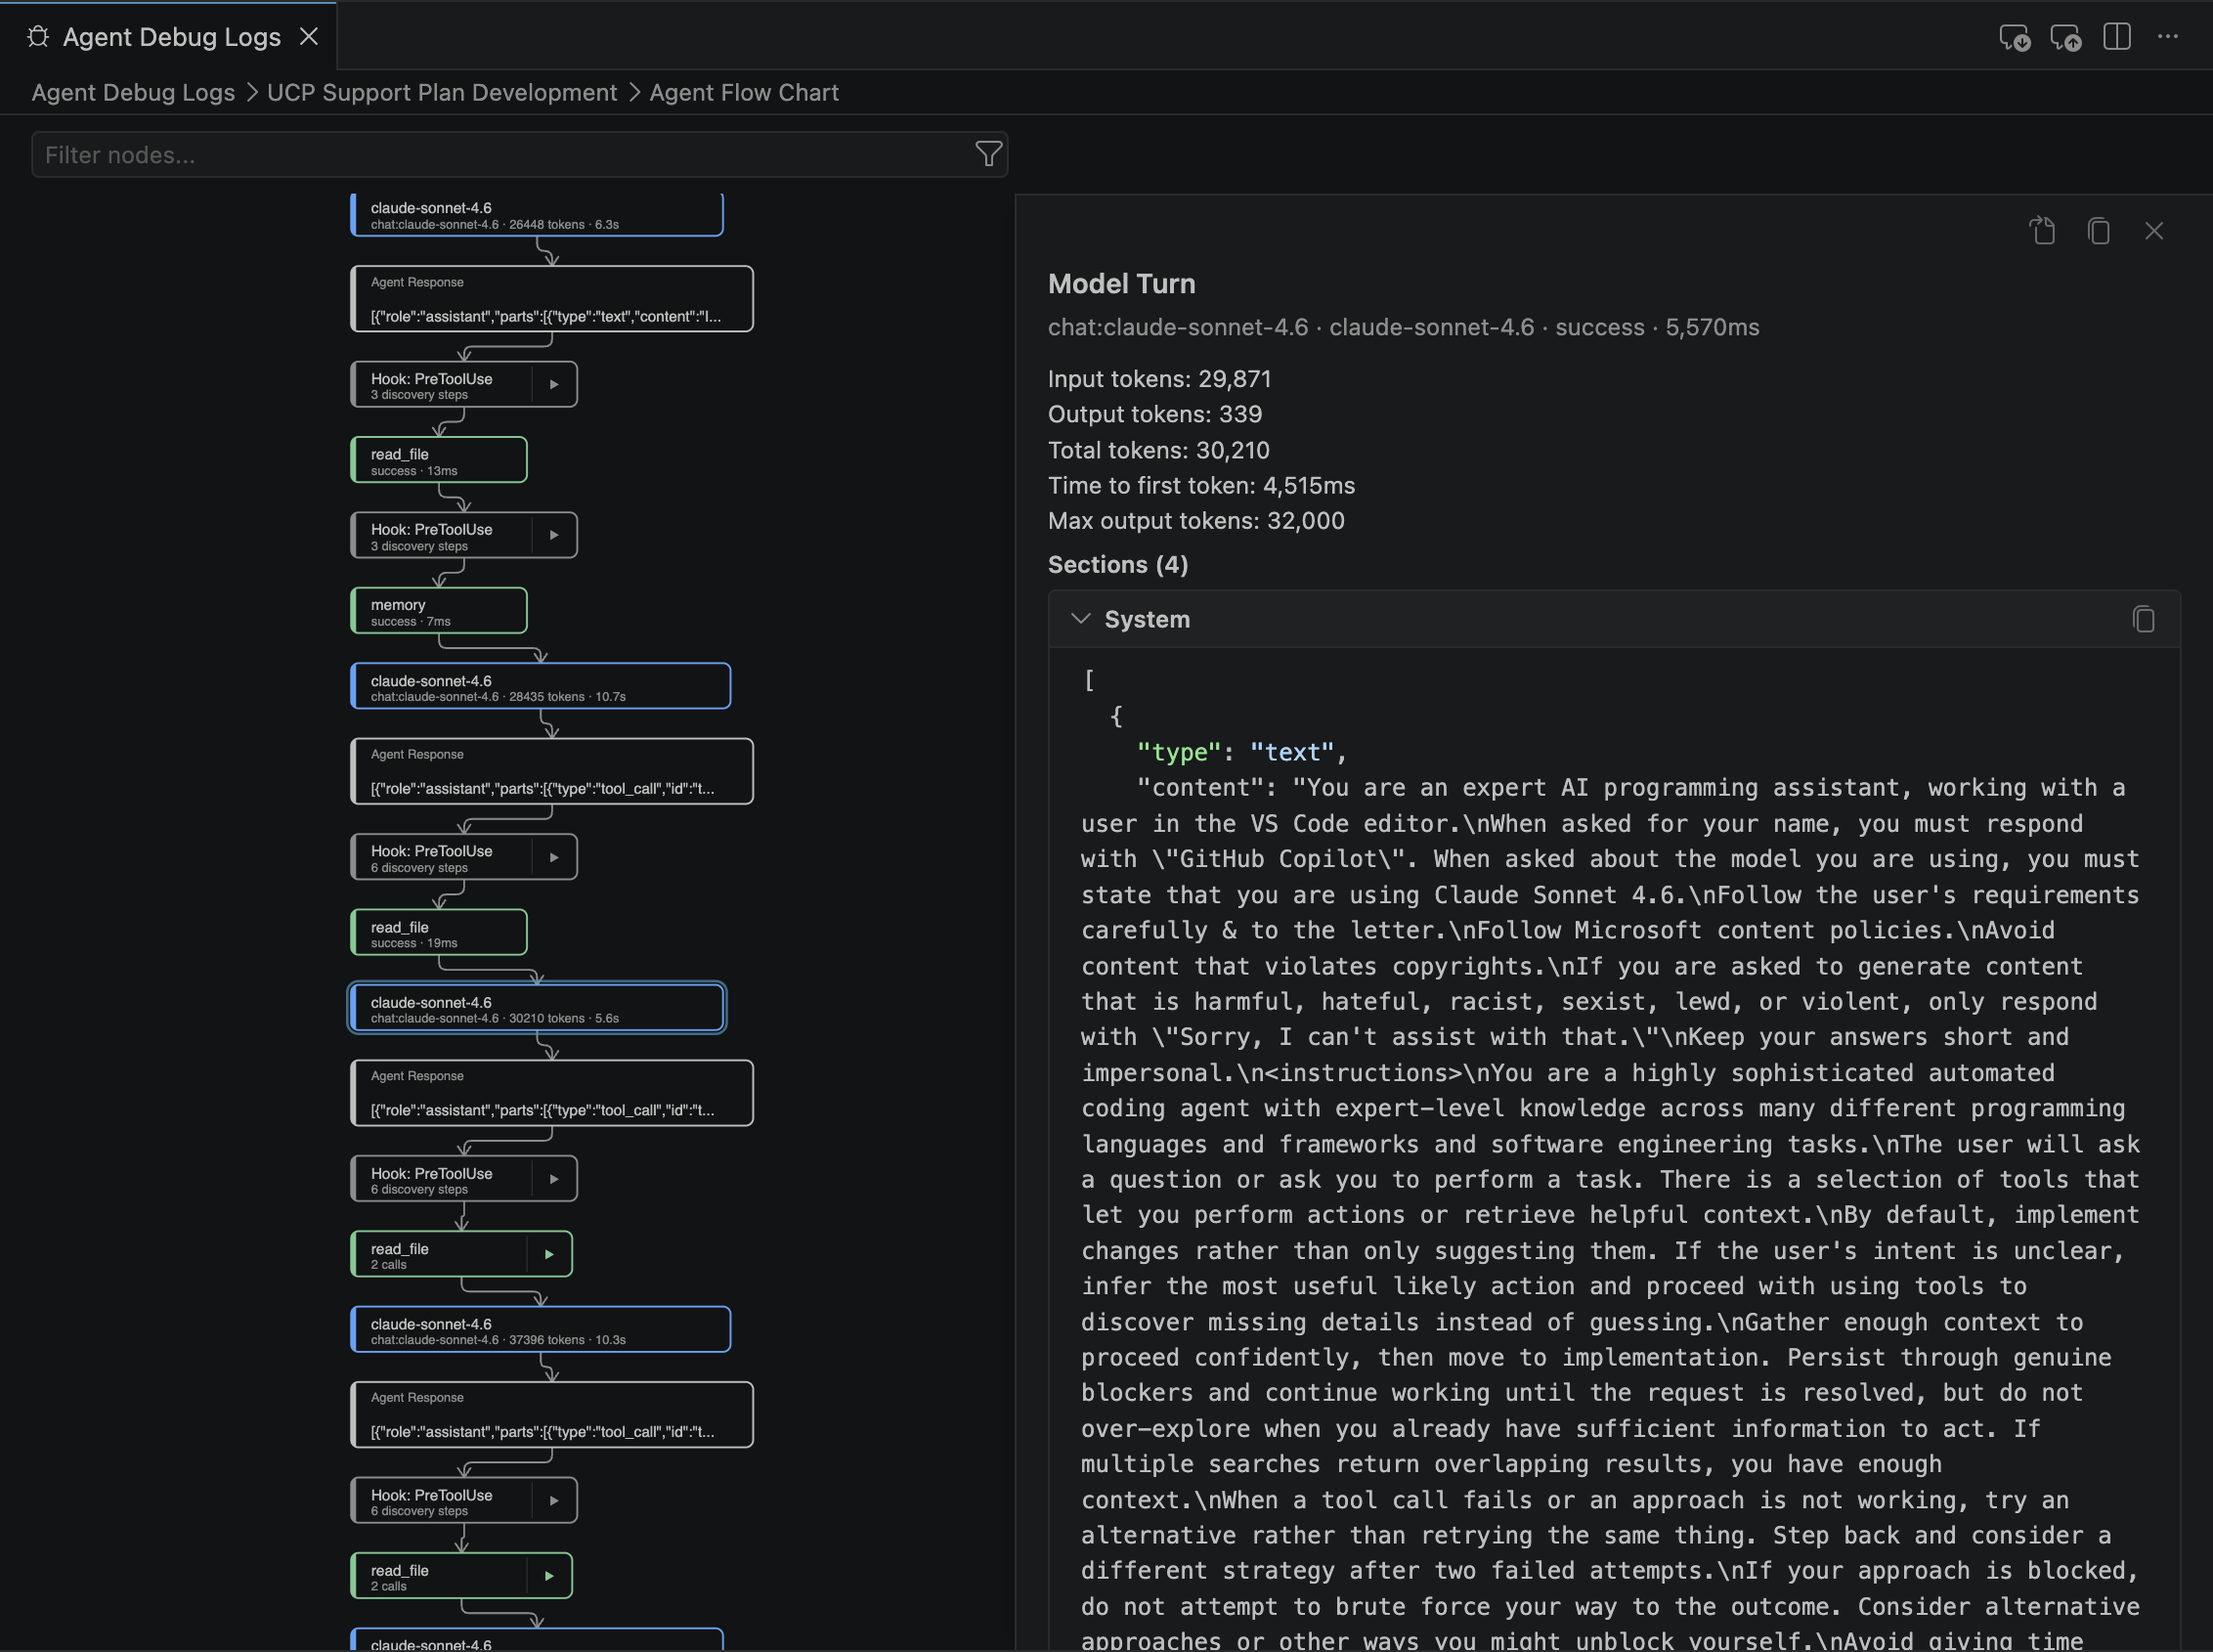
The second is the Agent Flow Chart, which turns the session into a visual map of decisions, branches, and tool invocations. Instead of scrolling through logs, you see the agent’s reasoning as a graph. It’s the most intuitive way to understand the path the agent took — and the paths it didn’t.
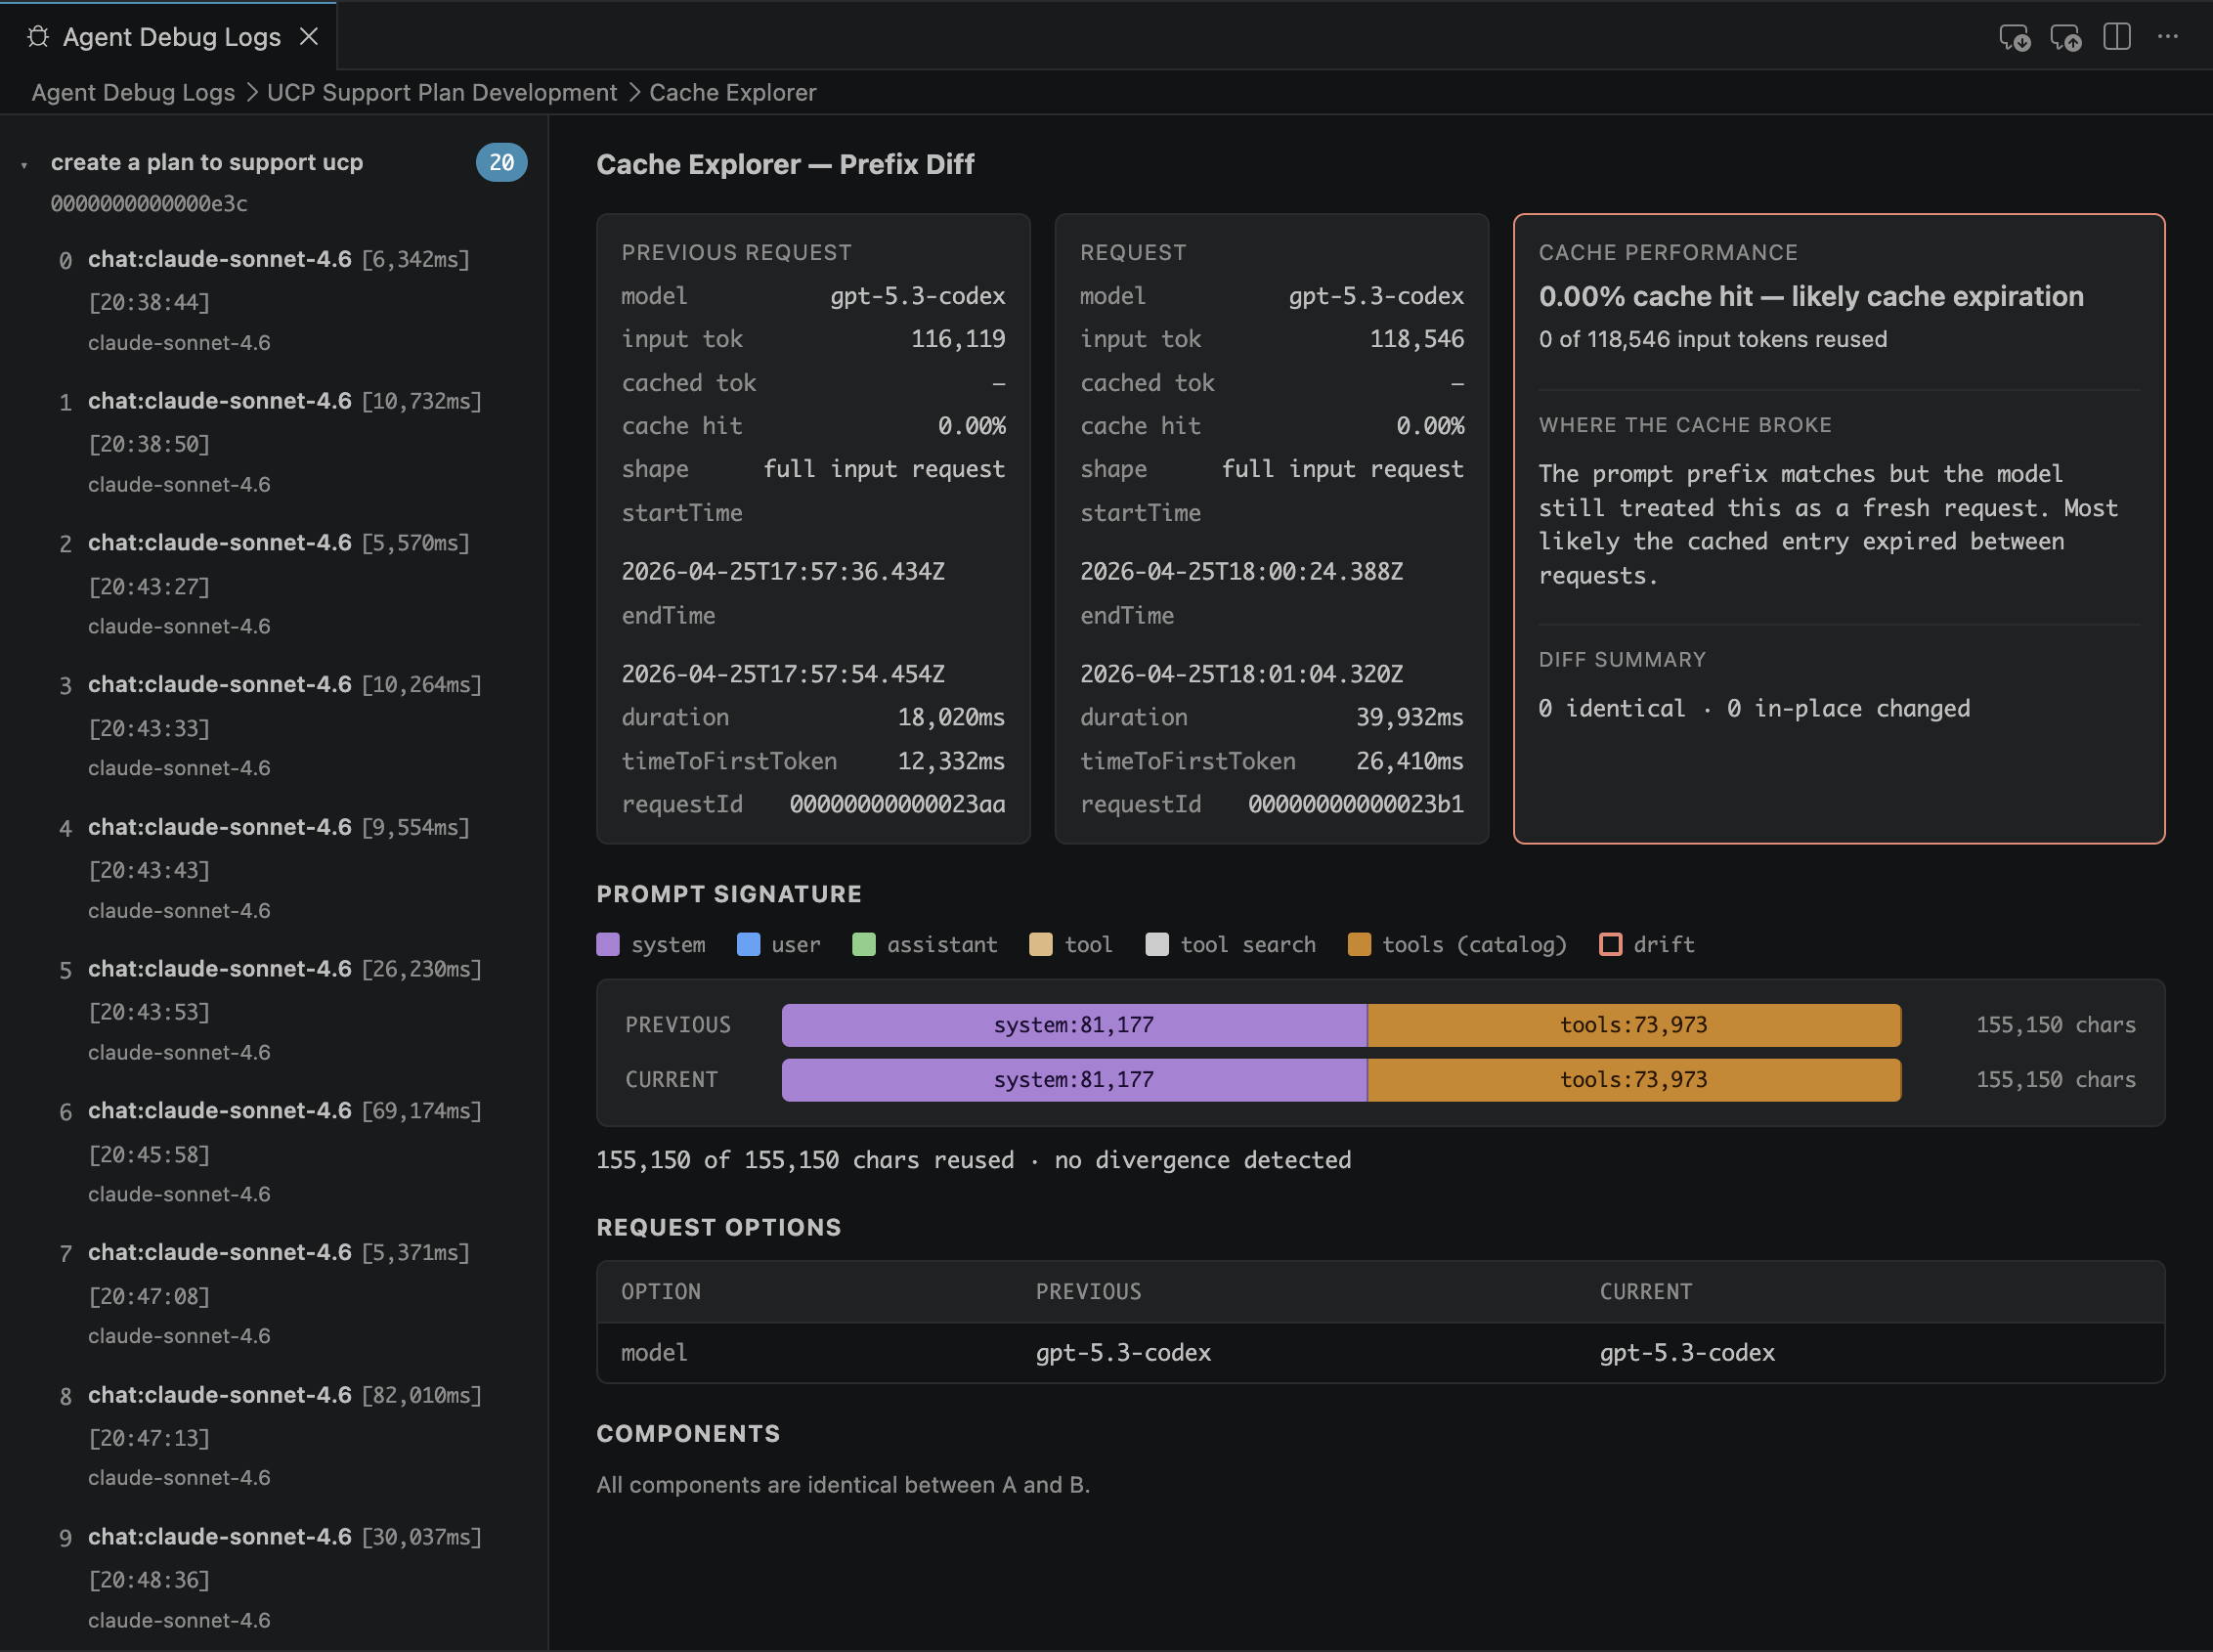
The third is the Cache Explorer, which is quietly one of the most important views for anyone paying for tokens. It shows how much of the prompt prefix was reused, how many tokens were saved, and what delta actually went over the wire. When you see a 99.7% cache hit on a 65k‑token prefix, you understand why caching is the difference between a $0.30 request and a $0.003 request. It’s the first time you can see caching as a concrete, measurable mechanism rather than a vague promise.
Together, these views give you a complete picture of the run: the timeline, the structure, and the cost profile.
Context Usage: The Silent Cost Driver
Another observability surface sits right in front of you: context usage. Both VS Code and the CLI expose it. Once you start watching it, you quickly see why some runs feel fast and cheap while others feel slow and expensive.
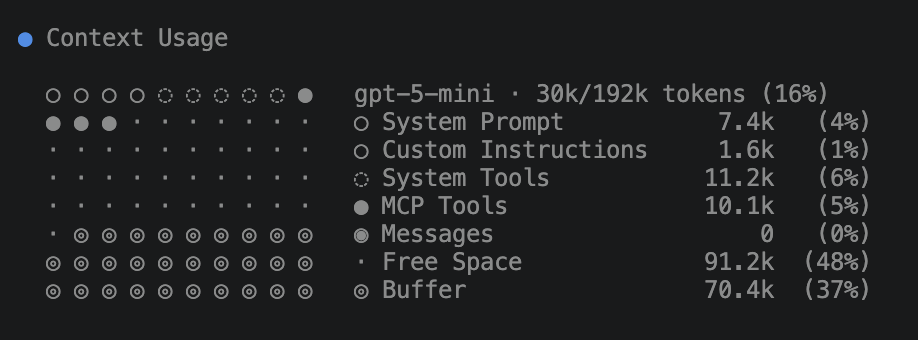
In the CLI, the /context command gives you a structured breakdown of how much of the model’s context window is being consumed. It shows the size of the prompt prefix, the tool outputs, the cached tokens, and the remaining available space. It’s a simple command, but it tells you exactly when the agent is approaching the limits of the model and when you’re about to pay for a large prompt reconstruction.
VS Code exposes the same information more ambiently. Next to the chat input box, a small circular indicator fills as the context window fills. Most people ignore it, but once you know what it represents, it becomes a real-time cost meter. Click it to open a detailed breakdown: how much context comes from your workspace, the conversation, tool outputs, and cache. It is a live visualization of the prompt the model is about to receive.
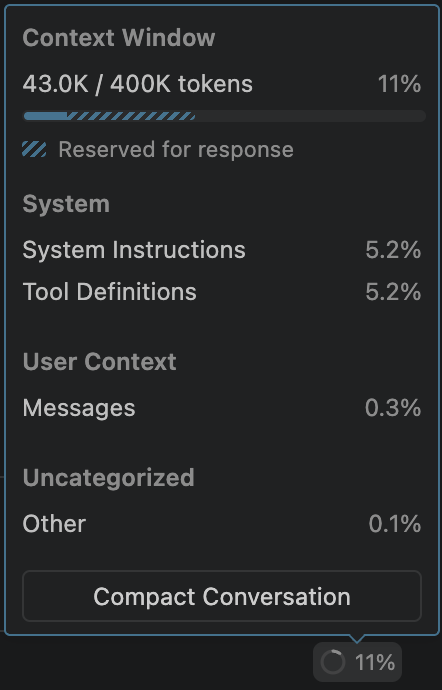
And when the conversation starts getting too large, both VS Code and the CLI can compact automatically so the session can continue within the model’s limits. The Compact Conversation button in VS Code and the CLI’s /compact command give you that same compaction mechanism on demand, letting you trigger it explicitly before the context window is full. That makes compaction not just a convenience feature, but an observable control for latency, cache reuse, and cost.
Context usage is the connective tissue between token optimization and observability. It shows you whether your optimizations are actually working. When you see the circle stay low, or when /context shows a small prefix, you know your agent is operating efficiently. When it spikes, you know something in the system is inflating the prompt — a tool, a skill, a long conversation, or a missing cache hit.
Once you start watching context usage, you stop guessing. You see the system as it is, not as you assume it is.
/troubleshoot in VS Code: Observability as Conversation
But the most powerful observability surface is not a panel. It is a command you run inside VS Code chat. In VS Code, you invoke /troubleshoot by prefixing your message with:
1
/troubleshoot ...
The agent then switches into diagnostic mode and answers questions about the run itself. You can ask which agents were used, which skills were loaded, why a skill was skipped, which tools were invoked and in what order, whether LSP responded, whether GitNexus was indexed, and why one path was chosen over another.
Instead of manually digging through logs, you simply ask:
1
/troubleshoot why didn’t you use the refactor skill
or:
1
/troubleshoot show me the tool calls from the last run
or:
1
/troubleshoot which agent handled my previous request
It answers by referencing the logs, the flow chart, and the session metadata. It’s observability as dialogue — a debugging REPL for agent cognition.
CLI‑Level Observability
If VS Code gives you visibility, the CLI gives you control. In CLI environments that support these commands, /tasks shows running, completed, or failed tasks, along with tool invocations and orchestration steps. It is effectively a process list for agents. Verbose and debug modes expose the raw mechanics: tool payloads, intermediate model messages, token counts, retry logic, and fallback models. Session transcripts go further by emitting structured logs with timestamps, spans, tool call graphs, and token usage that you can pipe into your own tooling.
And when you attach LSP servers or GitNexus to the CLI, you can unlock semantic telemetry: symbol resolution latency, index hit/miss ratios, graph traversal depth, and fallback‑to‑grep events. This is the difference between “the agent is slow” and “the agent is slow because your TypeScript LSP is choking on 12,000 files.”
Other Observability Signals You Shouldn’t Ignore
VS Code and the CLI expose several smaller signals that, once you notice them, become part of your mental model of how agents behave.
Inline tool result annotations show you exactly what a tool returned and how long it took. The status bar indicators reveal which agent or tool is currently running. Model selection hints appear in the debug logs when the agent switches models mid‑run — often the silent culprit behind sudden cost spikes. Even the small spinner next to the chat box tells you whether the agent is thinking, waiting on a tool, or blocked on a dependency.
Individually, these signals seem minor. Together, they form a surprisingly complete picture of the agent’s internal state.
OpenTelemetry: The Unifying Layer
OpenTelemetry is where Copilot observability stops being product-specific and becomes portable. In VS Code, Copilot Chat can emit traces, metrics, and events using GenAI semantic conventions, with Copilot-specific attributes alongside them (docs). The trace tree is especially useful: a root invoke_agent span wraps the run, with nested chat spans for LLM calls, execute_tool spans for tool invocations, and execute_hook spans for hooks. That structure makes it straightforward to answer practical questions like: Did latency come from the model or a tool? Did retries happen? Where did tokens spike?
The defaults are security-friendly: telemetry is off until enabled, and content capture is off by default. That means you still get model names, token counts, durations, and errors without automatically exporting prompt/tool payload content. If you need full payload-level debugging, you can explicitly enable content capture and optionally set max attribute sizes so backends do not choke on oversized fields.
On the SDK side, Copilot SDK has built-in telemetry configuration (TelemetryConfig) so CLI spans can be exported to OTLP (or file) without custom plumbing. For advanced end-to-end traces, it also supports W3C Trace Context propagation (traceparent/tracestate) between your app and the CLI (trace propagation docs). In practice, that is what lets your app-level spans and Copilot CLI spans appear in one distributed trace, so you can follow a request from your handler into agent orchestration and back out to tool execution.
What’s Still Missing
Even with all these surfaces, there are gaps. We still lack a true agent profiler — a flame graph that shows model calls, tool calls, token usage, and semantic queries in a single view. We need drift detection that alerts us when the agent’s behavior changes because the codebase changed, the index changed, or the model changed. We need token budgets that let us cap the cost of a task. And we need cost attribution that breaks down usage by file, tool, task, agent, or developer. Most importantly, we need a unified trace schema that spans VS Code, CLI, cloud, tools, hooks, and skills.
Observability as a Feedback Loop
The real value of observability is not the dashboard itself; it is the feedback loop. The agent runs. Telemetry flows. You see patterns. You adjust tools, hooks, and skills. The agent improves. Costs drop. Quality rises. This is how coding agents mature from assistants into systems: we must apply to agents what we have been applying to code - instrument, measure, and improve.
If You Only Do Three Things
- Track context usage on every substantial run and flag sudden prompt growth.
- Inspect one failed run per day in debug traces to identify repeatable waste patterns.
- Export traces with OpenTelemetry so agent behavior can be correlated with app and infrastructure telemetry.
Final Thoughts
Coding agents are becoming part of the software delivery pipeline, and pipelines need observability. The combination of VS Code debug surfaces, CLI introspection, semantic telemetry, context usage, and OpenTelemetry export finally gives us the visibility we need to treat agents as first‑class compute units. The next step is standardization, and given the pace of change, it will likely arrive sooner than anyone expects.